Time Series Datasets
Teshekpuk Lake Ice-Off Trend, 1974-2022
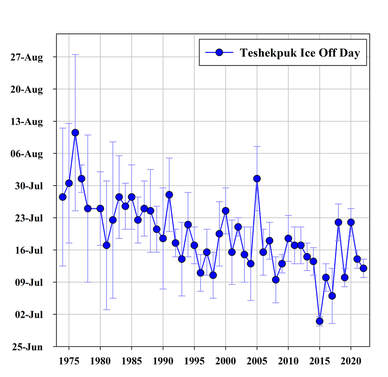
Day of the year for complete ice-off on Teshekpuk Lake from 1974 to 2022. This was determined using a variety of remotely sensed imagery from the satellite image archive. Ice-off day is portrayed as the mid-point between the day with the last image showing ice on the lake and the next available image showing no ice on the lake.
Data can be downloaded here.
Data can be downloaded here.
Ground temperature data, 2011-2021
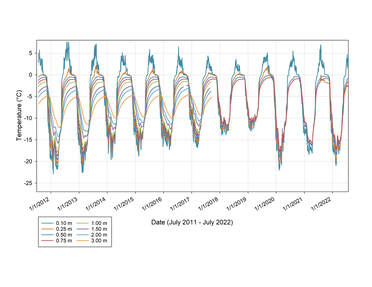
TLO daily mean ground temperature data measured at depths of 0.10 m, 0.25 m, 0.50 m, 0.75 m, 1.00 m, 1.50 m, 2.00 m, 3.00 m between July 2011 and July 2022. The datalogger measures active layer and permafrost temperature in the middle of an ice wedge polygon center typical of flat-centered polygonal terrain. This site contributes to the NSF-funded Thermal State of Permafrost program.
Data can be downloaded here.
Data can be downloaded here.
Ground temperature data, 2009-2021
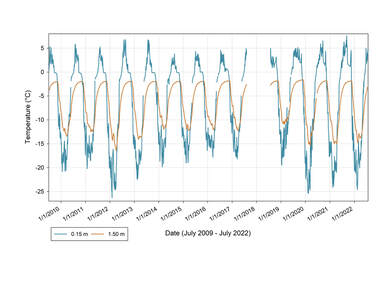
TLO daily mean ground temperature data measured at 0.15 m and 1.50 m depth from 2009 to 2022. The datalogger measures active layer and permafrost temperature in the middle of an ice wedge polygon center typical of high-centered polygonal terrain.
Data can be downloaded here.
Data can be downloaded here.
TLO Weather Station Data, August 2019 to October 2021
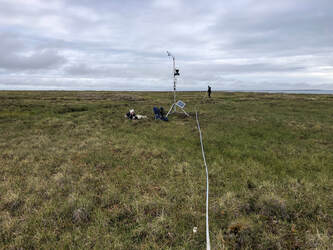
A telemetered weather station was added at the TLO in August 2019. Measurements include Air Temperature, Relative Humidity, Atmospheric Pressure, Rainfall, Wind Speed and Direction, Active Layer Temperature (10 cm), Permafrost Temperature (100 cm), and Soil Moisture. The ONSET HOBO U30 station records observations at 15 minute intervals. Note records are intermittent due to some sensor and station failures.
Data from 2019 to 2020 can be downloaded here.
Data from 2021 can be downloaded here.
Data from 2019 to 2020 can be downloaded here.
Data from 2021 can be downloaded here.
Water Level Data, August 2019 to Freeze-Up 2019
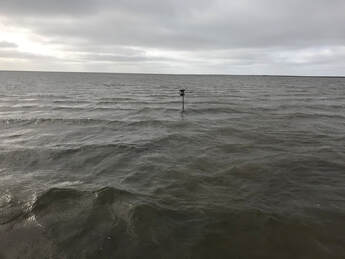
An iGage water level logger was installed at the TLO in August 2019. Water level measurements have been calibrated to meters above sea level as measured at the nearby Ikpikpuk River Delta.
Data can be downloaded here.
Data can be downloaded here.
Teshekpuk Lake Ice Growth, January 2020 to May 2020
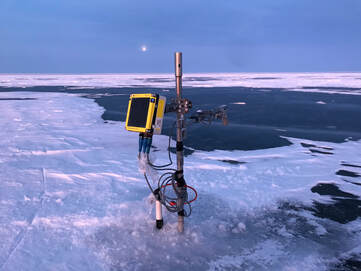
A BeadedStream Datalogger and 2 m long temperature cable were installed in the center of Teshekpuk Lake in January 2020 to measure the temperature of the ice and freezing lake water column through mid-May 2020. Temperature sensors are positioned at 0.0 m, 0.2 m, 0.4 m, 0.6 m, 0.8 m, 1.0 m, 1.1 m, 1.3 m, 1.4 m, 1.5 m, 1.6 m, 1.7 m, 1.8 m, 1.9 m, and 2.0 m.
Data can be downloaded here.
Data can be downloaded here.
Teshekpuk Lake Temperature Data, July 2021 to October 2021
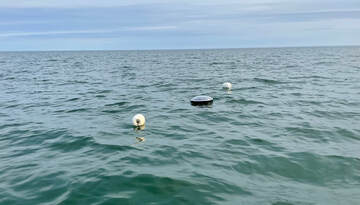
A BeadedStream Datalogger and 6 m long temperature cable were installed in a buoy that is located at a lake depth of 6.5 m in July 2021 to measure the temperature of the lake at three depths, 1 m, 2m, and 6m, in the water column. The data are streamed near real-time to here.
Data can be downloaded here.
Data can be downloaded here.